
What does the protein score measure?
The score combines protein per 100 calories, estimated cost per 30 grams of protein, added sugar, sodium, saturated fat, and the apparent protein source.
Food and product intelligence
A CLEARER LOOK AT EVERY LABEL.Compare protein powders, drinks, bars, cereals, bakery products, snacks, dairy products, and comfort foods using label math that stays visible.
Free to use · No sign-up needed

Enter the values from your package.
See the density, price and tradeoffs.
Product intelligence
Barcode support uses the browser's native detector when available.
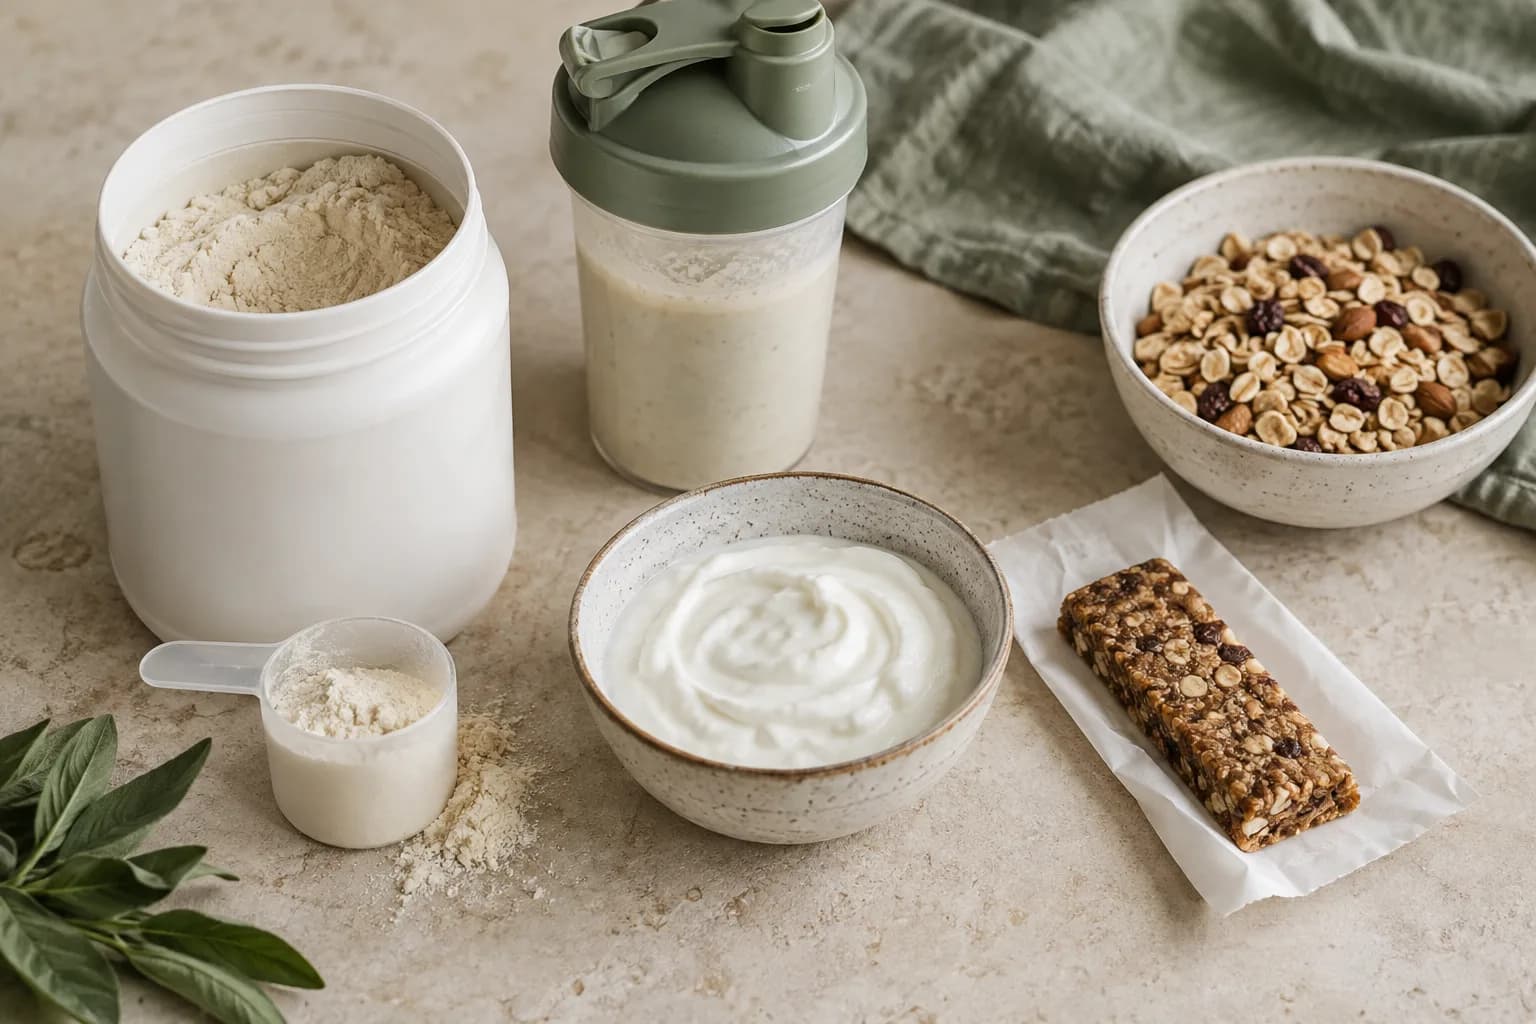
Editable label-style examples for common high-protein product formats, including powder-specific examples.
| Product | Density | Cost/g | Cost/30 g | Flags | Load |
|---|---|---|---|---|---|
Whey RTD shake 1 bottle, 330 ml | 18.8 g | $0.12 | $3.5 | Sugar LowSodium Moderate | |
Plant protein shake 1 carton, 330 ml | 11.8 g | $0.15 | $4.5 | Sugar LowSodium Moderate | |
Plain Greek yogurt cup 1 cup, 170 g | 15 g | $0.1 | $3 | Sugar LowSodium Low | |
Low-sugar protein bar 1 bar, 60 g | 9.1 g | $0.1 | $3 | Sugar LowSodium Moderate | |
High-protein cereal 1 cup, 55 g | 8.7 g | $0.07 | $2.18 | Sugar ModerateSodium Moderate | |
Protein cookie 1 cookie, 85 g | 4.4 g | $0.17 | $5.16 | Sugar HighSodium Moderate | |
Protein pasta serving dry pasta serving, 85 g | 6.5 g | $0.04 | $1.34 | Sugar LowSodium Low | |
Frozen protein bowl 1 bowl, 312 g | 6.6 g | $0.2 | $6.1 | Sugar ModerateSodium High | |
Cottage cheese cup 1 cup, 226 g | 13.6 g | $0.08 | $2.36 | Sugar LowSodium Moderate | |
Beef jerky snack 1 pouch, 32 g | 11.1 g | $0.23 | $6.75 | Sugar ModerateSodium High | |
Whey protein powder 1 scoop, 31 g | 20 g | $0.06 | $1.87 | Sugar LowSodium Moderate | |
Whey isolate powder 1 scoop, 30 g | 22.7 g | $0.07 | $2.2 | Sugar LowSodium Low | |
Micellar casein powder 1 scoop, 34 g | 19.2 g | $0.07 | $2.14 | Sugar LowSodium Moderate | |
Plant protein blend powder 1 scoop, 36 g | 16 g | $0.08 | $2.5 | Sugar LowSodium Moderate | |
Clear whey isolate powder 1 scoop, 25 g | 22.2 g | $0.11 | $3.22 | Sugar LowSodium Moderate | |
Collagen peptides powder 1 scoop, 20 g | 25.7 g | $0.08 | $2.5 | Sugar LowSodium Low | |
Collagen protein drink 1 bottle, 355 ml | 16.7 g | $0.22 | $6.5 | Sugar LowSodium Low |
Scores are shopping estimates, not medical advice. Use the exact Nutrition Facts or Supplement Facts label for branded products, check allergens and serving size, and treat barcode scans as identifiers rather than verified nutrition data. Protein powder labels can change by brand, flavor, country, package size, and reformulation date.
Day 4 extends this existing score calculator instead of creating a duplicate cost or label analyzer. Use powder mode for whey, isolate, casein, clear whey, pea, soy, collagen, and blended powders, then replace sample values with the exact brand and flavor label.
Protein per 100 calories makes a shake, bar, cereal, or frozen bowl easier to compare without trusting front-of-pack claims.
Cost per 30 grams of protein separates convenient products from expensive packaging.
Added sugar, sodium, and saturated fat are shown as percent Daily Value so tradeoffs are visible.
The score combines protein per 100 calories, estimated cost per 30 grams of protein, added sugar, sodium, saturated fat, and the apparent protein source.
Protein per 100 calories makes products easier to compare across different serving sizes. It shows whether a product is truly protein-dense or just a larger serving.
Added sugar and sodium are converted to percent Daily Value using FDA Daily Values. The FDA general guide treats 5% DV or less as low and 20% DV or more as high.
No. The browser barcode scanner captures an identifier. Nutrition values still need to come from the package label, a verified branded-food database, or the manufacturer's current label.
Yes. Use powder mode to load powder examples, then replace the sample values with the exact Nutrition Facts or Supplement Facts label from your tub. The tool compares protein per 100 calories, cost per gram protein, cost per 30 grams protein, added sugar, sodium, saturated fat, and protein source quality.
Protein powder labels can change by flavor, serving size, country, package size, and reformulation date. A vanilla whey isolate, chocolate whey blend, and clear whey from the same brand can have different calories, sodium, sweeteners, and protein grams.